Robinson, Caitlin (2021) Sub-regional energy poverty indicators. EP-pedia, ENGAGER COST Action.
Sub-regional indicators are statistics disaggregated into units of a high spatial resolution (e.g. a city region or neighbourhood). Sub-regional indicators are increasingly applied to understand the geographic distribution of energy poverty. This entry explores the complex geography of energy poverty; the key challenges associated with indicator selection; potential indicators of symptoms and drivers; and the application of indicators in policy and beyond.
Energy inequalities between and within countries
Spatial relations between, for example, people and the built environment, are central to politics and power (Massey, 2005). The spatial distribution of these relations mirror power relations in society; energy poverty is no exception (Sareen et al. 2020).
Uneven power relations are reflected in the way in which energy poor households with similar characteristics and needs cluster geographically. Experience of energy poverty therefore varies between national contexts and is also spatially variable within countries, with uneven implications for different neighbourhoods and household types (Thomson et al. 2017). For example, in Central and Eastern European countries single-person households in sparsely-populated areas are more likely to struggle to afford energy bills owing to reliance on a single income (Karpinska and Smeich 2020). Meanwhile, in the United Kingdom (UK) privately rented dwellings concentrated in inner city areas are disproportionately inefficient, whilst tenants lack housing rights or access to retrofitting schemes (Cauvain and Bouzarovski, 2016).
Uneven power relations are also reflected in the spatial unevenness of connectivity, within and between cities. This has led to a splintering (Graham and Marvin, 2001), and even shrivelling (L’Hostis, 2009) of space owing to material inequalities that exclude selected people and places - including inequalities in domestic energy. Such processes are especially relevant to energy poverty, given the integral role of networked infrastructures (e.g. gas or electricity networks). As a result, new energy peripheries have emerged where people are at greater risk of energy poverty due to uneven geographical development. Examples range from rural, off-grid communities in Wales that lack economic agglomeration advantages (Golubchikov and O’Sullivan, 2020) to minority Roma neighbourhoods in Romania and Israel, characterised by overcrowded, informal housing conditions (Teschner et al. 2020).
Key challenges in designing sub-regional indicators
There is a long history in the social sciences of using sub-regional quantitative indicators to represent the uneven spatial distribution of poverty, and increasingly of energy poverty. However, energy poverty has certain characteristics that complicate the design of indicators:
- Energy poverty is multidimensional. This presents a challenge when considering how to aggregate multiple drivers into a single measure.
- Energy poverty is a highly personal and private condition. Many aspects can be difficult to represent using small area datasets.
- Energy poverty data is constrained. This is especially the case for sub-regional datasets that represent energy poverty at a high spatial resolution, which are limited in many national contexts where detailed administrative data is not collected.
- Hard to measure aspects of energy poverty can be silenced. During indicator selection, selected drivers or symptoms are often privileged (Sareen et al. 2020).
Sub-regional indicators of symptoms and drivers
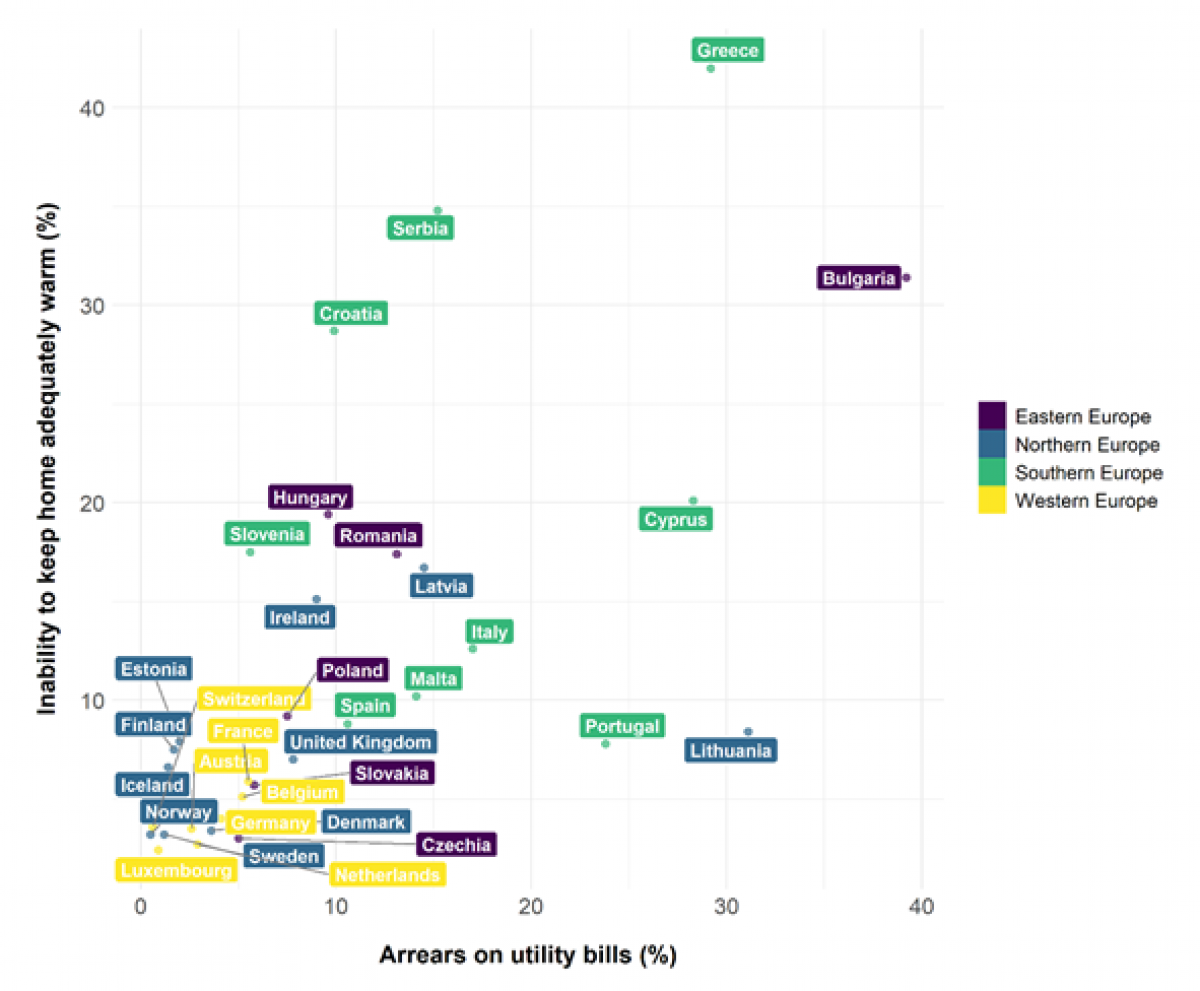
Sub-regional indicators typically fall into two categories, representing the symptoms or drivers of energy poverty. A range of symptoms can be measured include low indoor temperatures, poor physical and mental health, high or low energy consumption, and debt. Analyses of symptoms tend to prioritise absolute measures. An absolute scale begins at a known minimum and progresses in only one direction. It is used when a true minimum is known to exist (e.g. 0-100%). Examples include EU-SILC indicators used by the EU Energy Poverty Observatory to monitor energy poverty (Figure 1). Absolute measures are useful to compare propensity between countries, and across time (Moore, 2012); however, it can be difficult to differentiate symptoms of energy poverty from other deprivation types.
Drivers of energy poverty are financial (high energy prices, low incomes); social and demographic (physiological need, household composition, tenure); and infrastructural (efficiency, access to fuels). These drivers intersect with a range of structural forms of inequality including race, ableness, age, and gender (Reames, 2016; Snell et al. 2015; Petrova and Simcock, 2019; Chard and Walker, 2016). Analyses of drivers tend to prioritise relative measures that reflect whether a person feels disadvantaged in proportion to others.
To understand how the multiple dimensions of energy poverty coincide geographically, composite indicators are often used that compile a series of individual indicators into a single index. Composite indicators reveal where variables spatially coincide in a neighbourhood, resulting in a greater propensity to energy poverty. For a review of composite energy poverty indicators in the European context see Thomson et al. (2017). Although the specific multi-dimensional indicators selected vary according to geographic context, composite indicators are often structured around common frameworks. For example, the concept of vulnerability has been used to identify and combine multiple drivers that make a household more likely to experience the condition of energy poverty (Walker et al. 2012; Castaño-Rosa et al. 2020).
Sub-regional indicators in policy
The most established composite indicators of energy poverty that inform national scale policy have originated in England (UK): the ten percent indicator and the Low-Income High Cost (LIHC) indicator. These indicators have also been applied in other national contexts e.g. Poland (Sokolowski et al. 2020) and Southern Europe (Antepara et al. 2020). The ten percent indicator is an absolute measure that recognises households as energy poor if they spent over 10% of their income on energy. This was replaced in 2012 by a LIHC indicator (Hills, 2011), that recognises households as energy poor if their required fuel costs are above average and were they to spend that amount they would be left with an income below the poverty line.
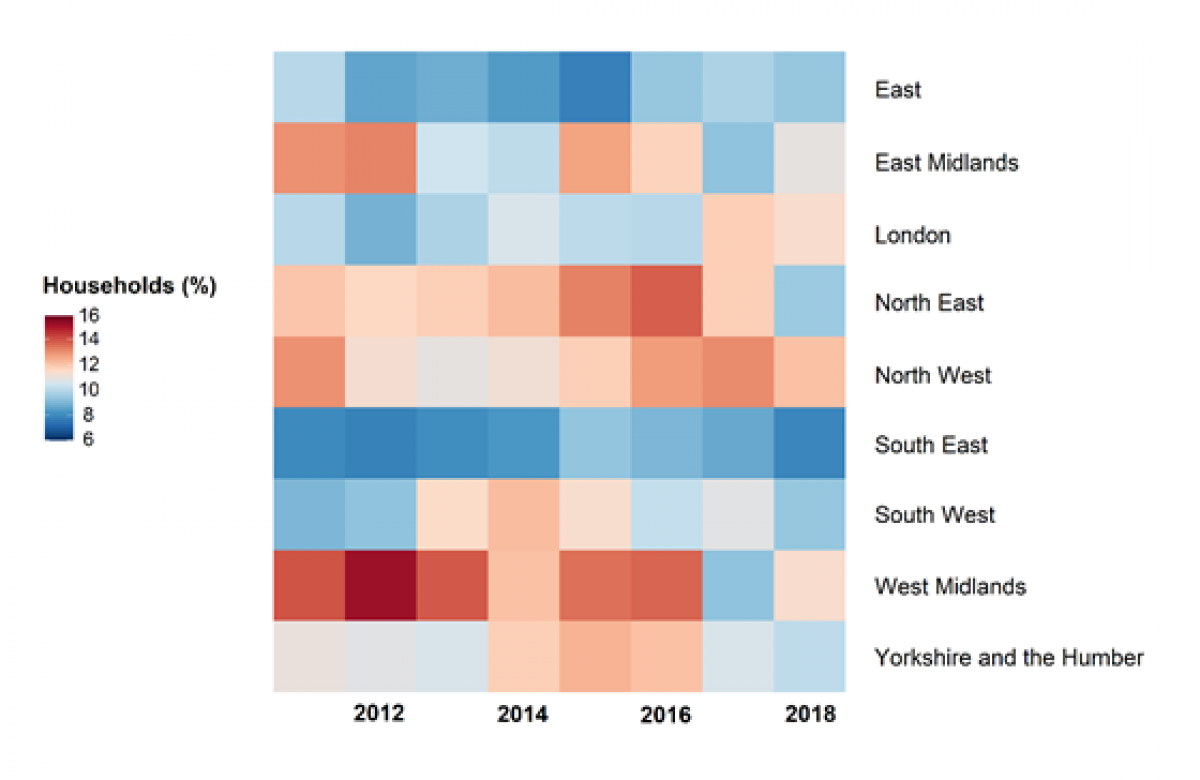
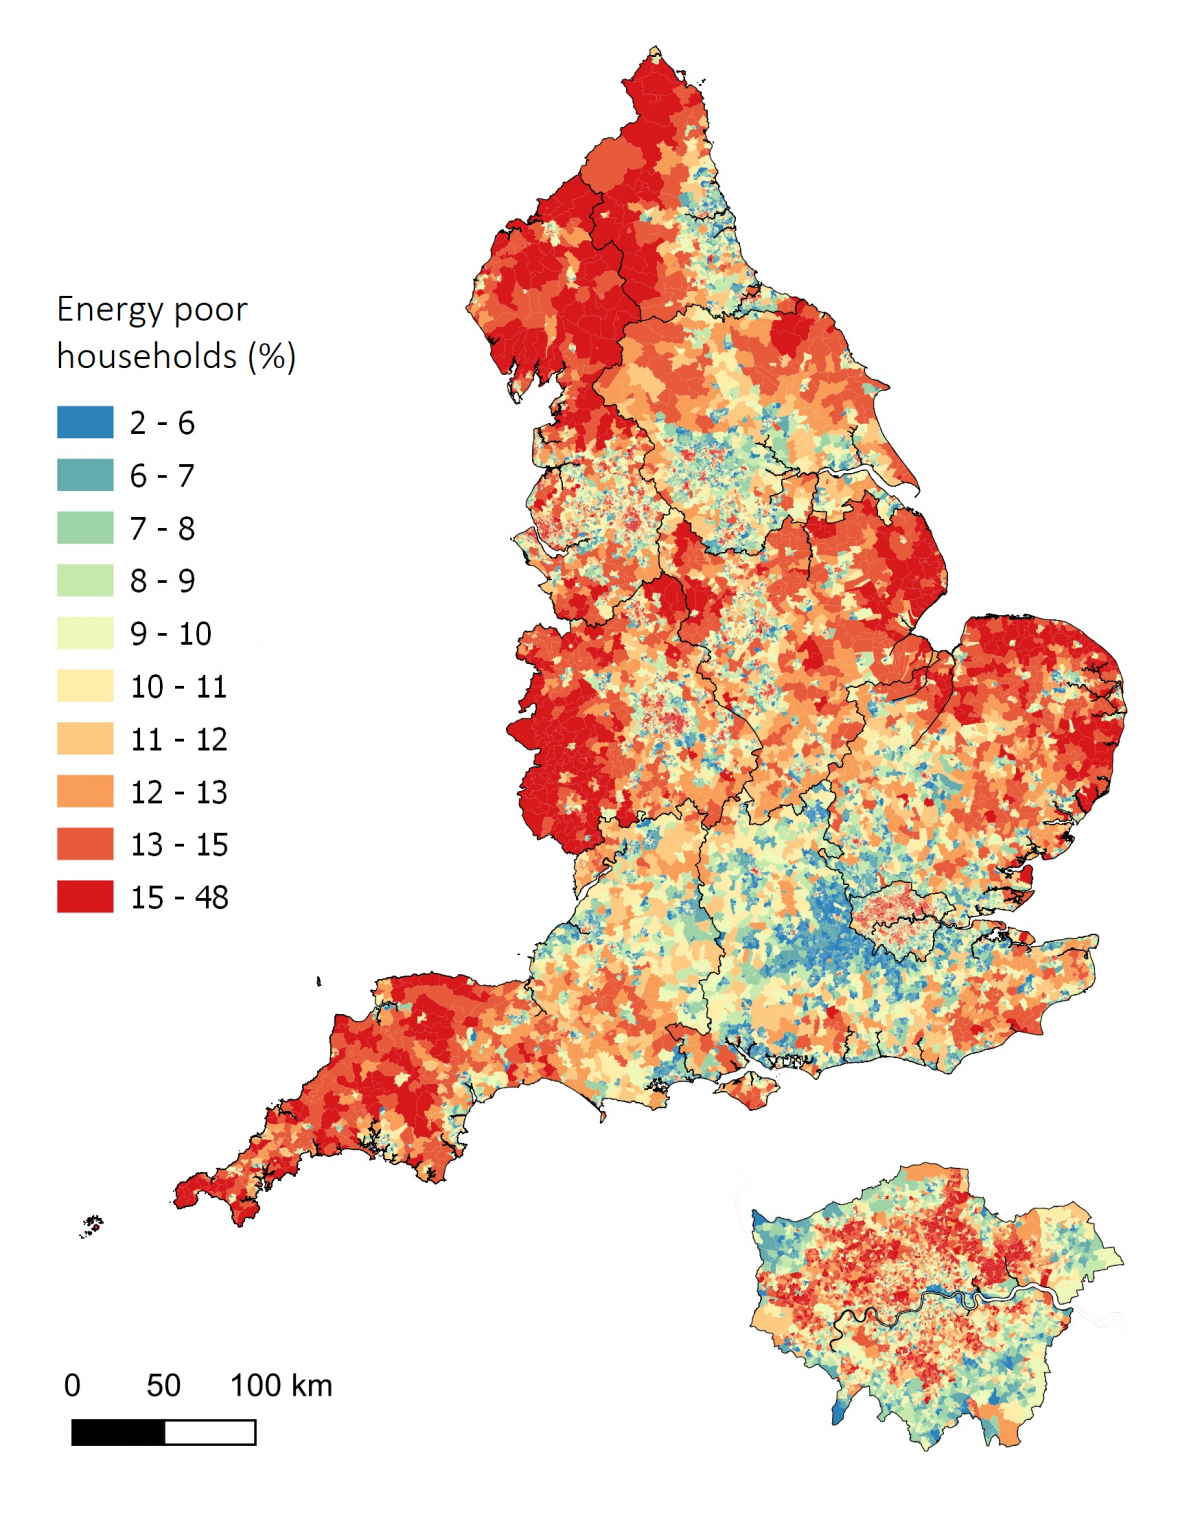
Using a LIHC indicator, 10.3% of households were considered energy poor in England during 2018 (BEIS, 2020). However, this national figure conceals substantial variations over space that sub-regional indicators can make visible. Figure 2 shows how the percentage of energy poor households across nine administrative regions changed from 2011 to 2018. Whilst over time, energy poverty has declined, it has risen in selected regions (London and the North West). Using a small area indicator, Figure 3 shows substantial variation in energy poverty, concentrating in both deprived urban areas and relatively remote rural areas.
Whilst national indicators play a role in profiling energy poverty in policy, they are necessarily simplistic, focusing on a small number of drivers (Walker and Day, 2012). When disaggregated to small areas, national indicators often fail to translate into appropriate criteria for identifying energy poor households (Boardman, 2012). With that in mind, which alternative sub-regional measures can be used in their place?
Wider sub-regional energy poverty indicators
Selected studies focus on explaining the spatial variations in a specific driver of energy poverty in a particular geographic context. In Northern Ireland (UK), Walker et al. (2015) analyses spatial differences in access to residential heating fuels that mean some households must rely on expensive oil for heating. Beyond the European context, in Kansas City (US), Reames (2016) examines the intensity with which households must use residential heating - a proxy for efficiency. The case study illustrates how racial and ethnic minority households and disadvantaged socioeconomic groups have a higher heating energy intensity.
Area-based composite indicators that consider a variety of energy poverty drivers have also emerged in different contexts (Gouveia et al. 2019; Horta, et al. 2019; Scarpellini et al. 2019; Robinson et al. 2019). After selecting appropriate indicators of financial, social and infrastructural drivers, a range of aggregation methods are used to derive a final composite indicator. In Portugal, Gouveia et al. (2019) combine socio-economic indicators, building characteristics and energy performance into an index to identify hot spots of energy poverty. Other examples use a weighting system, based on the importance of indicators in a specific policy context. In Northern Ireland, Walker et al. (2012) combine heating burden, built environment and social vulnerability, weighted 40%, 20% and 40% respectively.
These examples illustrate the potential for sub-regional indicators to provide detailed, locally-specific information about energy poverty propensity in different national contexts. However, there are opportunities to further develop indicators in the future, including by diversifying indicator selection; by accounting for change in indicators over time; and by analysing multiple forms of disadvantage at the same time e.g. transport, climate change adaptation) (Robinson, 2021).
Antepara, I., Papada, L., Gouveia, J. P., Katsoulakos, N., & Kaliampakos, D. (2020). Improving Energy Poverty Measurement in Southern European Regions through Equivalization of Modeled Energy Costs. Sustainability, 12(14), 5721. https://doi.org/10.3390/su12145721
BEIS (2020). Fuel poverty statistics. https://bit.ly/3m0UKvj
Boardman, B. (2012). Fuel poverty synthesis: Lessons learnt, actions needed: Fuel poverty comes of age: Commemorating 21 years of research and policy. Energy Policy, 49, 143-148. https://doi.org/10.1016/j.enpol.2012.02.035
Castaño-Rosa, R., Solís-Guzmán, J., & Marrero, M. (2020). Energy poverty goes South? Understanding the costs of energy poverty with the index of vulnerable homes in Spain. Energy Research & Social Science, 60, 101325. https://doi.org/10.1016/j.erss.2019.101325
Cauvain, J., & Bouzarovski, S. (2016). Energy vulnerability in multiple occupancy housing: a problem that policy forgot. People, Place and Policy, 10(1), 88-106. https://doi.org/10.3351/ppp.0010.0001.0007
Chard, R., & Walker, G. (2016). Living with fuel poverty in older age: Coping strategies and their problematic implications. Energy Research & Social Science, 18, 62-70. https://doi.org/10.1016/j.erss.2016.03.004
EPOV (2020). Indicators and Data. https://www.energypoverty.eu/indicators-data
Gouveia, J. P., Palma, P., & Simoes, S. G. (2019). Energy poverty vulnerability index: A multidimensional tool to identify hotspots for local action. Energy Reports, 5, 187-201. https://doi.org/10.1016/j.egyr.2018.12.004
Graham, S., & Marvin, S. (2001). Splintering urbanism: networked infrastructures, technological mobilities and the urban condition. Psychology Press.
Hills, J. (2012). Getting the measure of fuel poverty: Final Report of the Fuel Poverty Review.
Horta, A., Gouveia, J. P., Schmidt, L., Sousa, J. C., Palma, P., & Simões, S. (2019). Energy poverty in Portugal: Combining vulnerability mapping with household interviews. Energy and Buildings, 203, 109423. https://doi.org/10.1016/j.enbuild.2019.109423
Karpinska, L., & Śmiech, S. (2020). Invisible energy poverty? Analysing housing costs in Central and Eastern Europe. Energy Research & Social Science, 70, 101670. https://doi.org/10.1016/j.erss.2020.101670
L’Hostis, A. (2009). The shrivelled USA: representing time–space in the context of metropolitanization and the development of high-speed transport. Journal of transport geography, 17(6), 433-439. https://doi.org/10.1016/j.jtrangeo.2009.04.005
Liddell, C., & Morris, C. (2010). Fuel poverty and human health: a review of recent evidence. Energy policy, 38(6), 2987-2997. https://doi.org/10.1016/j.enpol.2010.01.037
Massey, D., & Massey, D. B. (2005). For space. Sage.
O'Sullivan, K., Golubchikov, O., & Mehmood, A. (2020). Uneven energy transitions: Understanding continued energy peripheralization in rural communities. Energy Policy, 138, 111288. https://doi.org/10.1016/j.enpol.2020.111288
Office for National Statistics (ONS) (2011) Lower Super Output Area Boundaries. https://bit.ly/338koFN
Moore, R. (2012). Definitions of fuel poverty: Implications for policy. Energy policy, 49, 19-26. https://doi.org/10.1016/j.enpol.2012.01.057
Petrova, S., & Simcock, N. (2019). Gender and energy: domestic inequities reconsidered. Social & Cultural Geography, 1-19. https://doi.org/10.1080/14649365.2019.1645200
Reames, T. G. (2016). Targeting energy justice: Exploring spatial, racial/ethnic and socioeconomic disparities in urban residential heating energy efficiency. Energy Policy, 97, 549-558. https://doi.org/10.1016/j.enpol.2016.07.048
Robinson, C., Lindley, S., & Bouzarovski, S. (2019). The spatially varying components of vulnerability to energy poverty. Annals of the American Association of Geographers, 109(4), 1188-1207. https://doi.org/10.1080/24694452.2018.1562872
Robinson, C. (Forthcoming). Spatial approaches to energy poverty. In: Rey, S., and Franklin, R. (2021) (Eds.) Handbook of Spatial Analysis in the Social Sciences. Edward Elgar Publishing.
Sareen, S., Thomson, H., Herrero, S. T., Gouveia, J. P., Lippert, I., & Lis, A. (2020). European energy poverty metrics: Scales, prospects and limits. Global Transitions, 2, 26-36. https://doi.org/10.1016/j.glt.2020.01.003
Scarpellini, S., Hernández, M. A. S., Moneva, J. M., Portillo-Tarragona, P., & Rodríguez, M. E. L. (2019). Measurement of spatial socioeconomic impact of energy poverty. Energy policy, 124, 320-331. https://doi.org/10.1016/j.enpol.2018.10.011
Snell, C., Bevan, M., & Thomson, H. (2015). Justice, fuel poverty and disabled people in England. Energy Research & Social Science, 10, 123-132. https://doi.org/10.1016/j.erss.2015.07.012
Sokołowski, J., Lewandowski, P., Kiełczewska, A., & Bouzarovski, S. (2020). A multidimensional index to measure energy poverty: the Polish case. Energy Sources, Part B: Economics, Planning, and Policy, 1-21. https://doi.org/10.1080/15567249.2020.1742817
Teschner, N., Sinea, A., Vornicu, A., Abu-Hamed, T., & Negev, M. (2020). Extreme energy poverty in the urban peripheries of Romania and Israel: Policy, planning and infrastructure. Energy Research & Social Science, 66, 101502. https://doi.org/10.1016/j.erss.2020.101502
Thomson, H., Bouzarovski, S., & Snell, C. (2017). Rethinking the measurement of energy poverty in Europe: A critical analysis of indicators and data. Indoor and Built Environment, 26(7), 879-901. https://doi.org/10.1177%2F1420326X17699260
Walker, R., Liddell, C., McKenzie, P., Morris, C., & Lagdon, S. (2014). Fuel poverty in Northern Ireland: humanizing the plight of vulnerable households. Energy Research & Social Science, 4, 89-99. https://doi.org/10.1016/j.erss.2014.10.001
Walker, R., McKenzie, P., Liddell, C., & Morris, C. (2015). Spatial analysis of residential fuel prices: Local variations in the price of heating oil in Northern Ireland. Applied Geography, 63, 369-379. https://doi.org/10.1016/j.apgeog.2015.07.016
Walker, G., & Day, R. (2012). Fuel poverty as injustice: Integrating distribution, recognition and procedure in the struggle for affordable warmth. Energy policy, 49, 69-75. https://doi.org/10.1016/j.enpol.2012.01.044