Antepara, I. (2021) Energy poverty and low income in Spain, EP-pedia, ENGAGER COST Action.
The relation between low income and energy poverty
Spain, compared with other Member States of the EU28, has a lower average disposable income of households per capita, as can be seen in Table 1.

The income gap between Spain and the EU average increased during the previous crisis beginning in 2008, after the bursting of the U.S. housing bubble which turned into a global financial crisis. Regarding energy poverty indicators, from 2005 to 2015 only self-reported indicators (based on EU-SILC data) are available and “Arrears on utility bills” numbers show a clear increase in energy poverty levels. Despite the relatively mild weather in Spain, the energy poverty indicators are average, quite possibly due to lower disposable incomes. Dubois and Meier (2016) analysed energy poverty across EU countries, and they concluded that energy inequality in Spain mainly affects low-income households – the same as in countries such as France, Hungary, Poland, Greece, Malta and Latvia – but not specifically certain household group(s).
One factor that can have great influence on whether low-income households fall into energy poverty is the price of energy. Electricity is a key component of Spain's domestic energy demand and the most costly item of the average household's energy bill. Although the Spanish electricity market was liberalised in 1997, it is still organised mainly around five large electricity companies. Other energy markets, e.g. fuel for transportation, involve only a few companies as well. When Spanish low-income households have to deal with heating, with the (little) money they can spend to warm the house, they rely on bottled butane and often on electricity. They cannot afford two different energy contracts (i.e. electricity and gas, which means paying two connection charges whatever the consumptions of the two), and they choose only electricity because it offers more energy services (lighting, communications…).
Spanish electricity consumers saw a 63 per cent nominal increase in electricity prices over 2006-2012 in comparison to only a 26 per cent increase in the EU28, according to Tirado and Jiménez Meneses (2016). Spain had the sixth highest electricity price in the EU in 2012. The difference is lower for the case of natural gas, with a 49 per cent increase for Spain against a 37 per cent average increase in the EU28. But adjusted gross disposable income of households per capita (SDG_10_20 Eurostat) in Spain decreased by 5.6 per cent during that period of time. Therefore, the cost of energy implied a greater effort for the Spanish consumer at the end of 2012. Data for energy expenditure – electricity, gas and other fuels in 2005, 2010 and 2015 – is shown in Table 2 disaggregated by income quintiles.
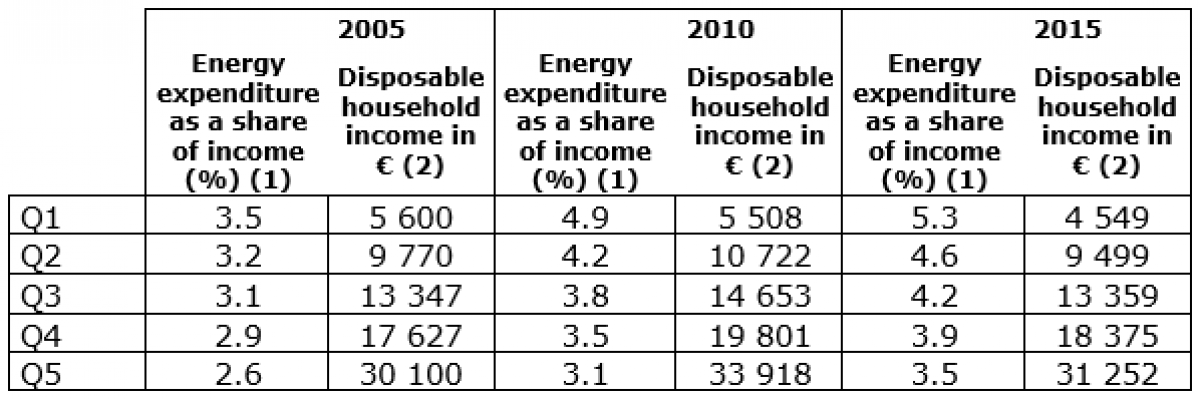
Energy expenditure as a share of income is higher for lower income households. Apart from the lower purchasing power, this could also be due to the so-call “poverty premium”; Davies et al. (2016) state that households on low incomes incur extra costs compared with households on higher incomes when purchasing the same energy services. Energy consumption expenditure data are in accordance with previously reported by Tirado and Jiménez Meneses (2016); as shown in the table, energy expenses increase as a share of income from 2005 to 2015. While this is true for all income quintiles, the proportionate increase is more in the lowest quintile than in the highest. Over the same period of time (2005-2015), for the first income quintile energy expenses represent 3.5 per cent of household income in 2005, increasing to 5.3 per cent ten years later, whereas for the top income quintile, energy expenses rise from 2.6 per cent in 2005 to 3.5 per cent ten years later. The percentage increase is higher for the first quintile, probably because the income of the first quintile decreased from 2005 to 2015, whereas the income of the fifth quintile increased.
One solution to lower energy costs may be tariff switching, as Antepara et al. (2020b) state in their work. The National Commission on Markets and Competition (Comisión Nacional de los Mercados y la Competencia, CNMC) analysed consumers' knowledge of energy markets, publishing the results in a press release in 2017 (available at https://www.cnmc.es/en/notas-de-prensa):
- Seven out of ten Spanish households do not know whether their natural gas or electricity supply is on the regulated or open market;
- 41% of Spanish households also do not know what type of electricity tariff they have contracted and 24% do not know what the contracted power – i.e. kW, which is linked to the fixed term of the tariff – is;
- Electricity suppliers have 56% of domestic customers contracted on their most expensive rates, which is an excessively high percentage, mainly due to the use of misinformation – e.g. by telemarketers or door-to-door sales agents –, and as a consequence the CNMC banned some of these practices.
Also confirmed by the CNMC, the electricity expenditure per month of a household client of the regulated market was 51.6 euro in December 2019 (or 48.9 euros if households on a social tariff are considered). In the free market, the average monthly expenditure on electricity supply was 63 euro per month (excluding expenditure on other billable services such as insurance or maintenance fees, which amount to an additional 5 euro per month). However, if the prices of power and electricity consumption in the regulated market are assigned to the average consumption obtained from free market bills, a monthly expense of 50.5 euro is obtained, i.e. 12.5 euro or 20% less than that invoiced on average to free market households. Although supplier switching rates are high in Spain, more than 10%, surprisingly enough the potential savings are only around 75 euro/year for an average household. In the end, if Spanish consumers’ expectations of potential gains were considerably lower than those available in the market, this means that people in Spain are particularly reluctant to consider a different energy supplier or trust new energy suppliers.
Moving to study the effect of these price increases and income shifts on energy poverty indicators, Table 3 is made up of disaggregated data by income deciles based on self-reported experiences of limited access to energy services (based on EU-SILC data), also for the years 2005, 2010 and 2015.
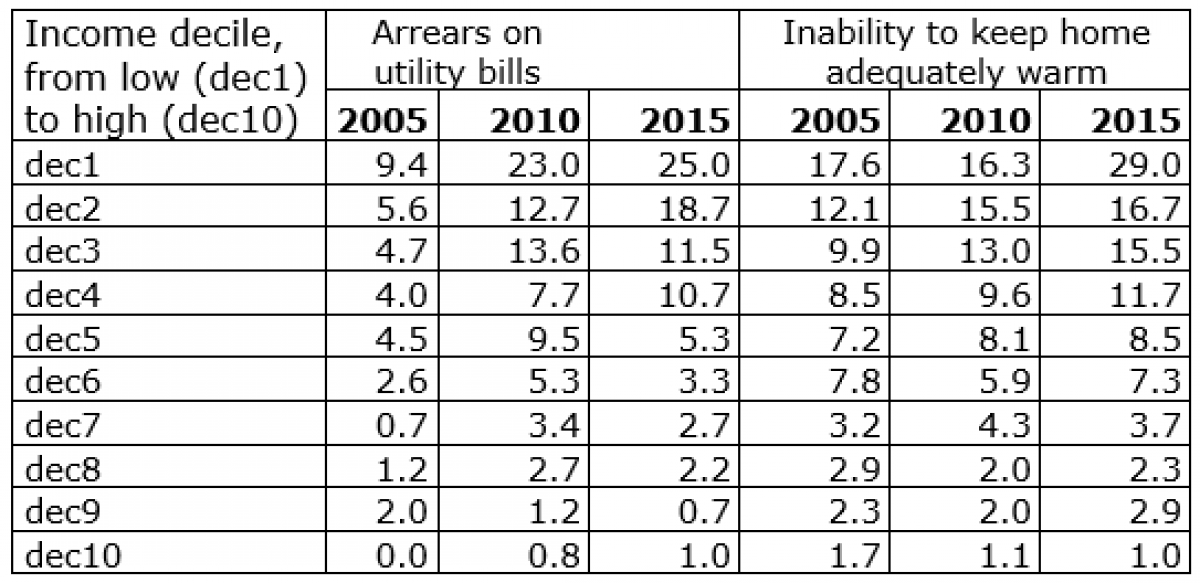
Vondung and Thema (2019) described this unsurprising distribution as degression by income deciles, i.e. high shares of energy poor households in the lower income deciles and lower shares in the higher income deciles – which holds especially true for 2015 figures. An overview analysis of inequalities for Spain, including low income, was published by ACA (Asociación de Ciencias Ambientales) in their report of 2018. It is the most up-to-date data for Spain, and the conclusions comparing data in 2007 and 2016 are in accordance with Vondung and Thema (2019).
Using household income and/or energy expenditure data (based on Household Budget Survey data), Table 4 gathers objective indicators for 2010 and 2015, and calculated values for 2015 by Romero et al. (2018).
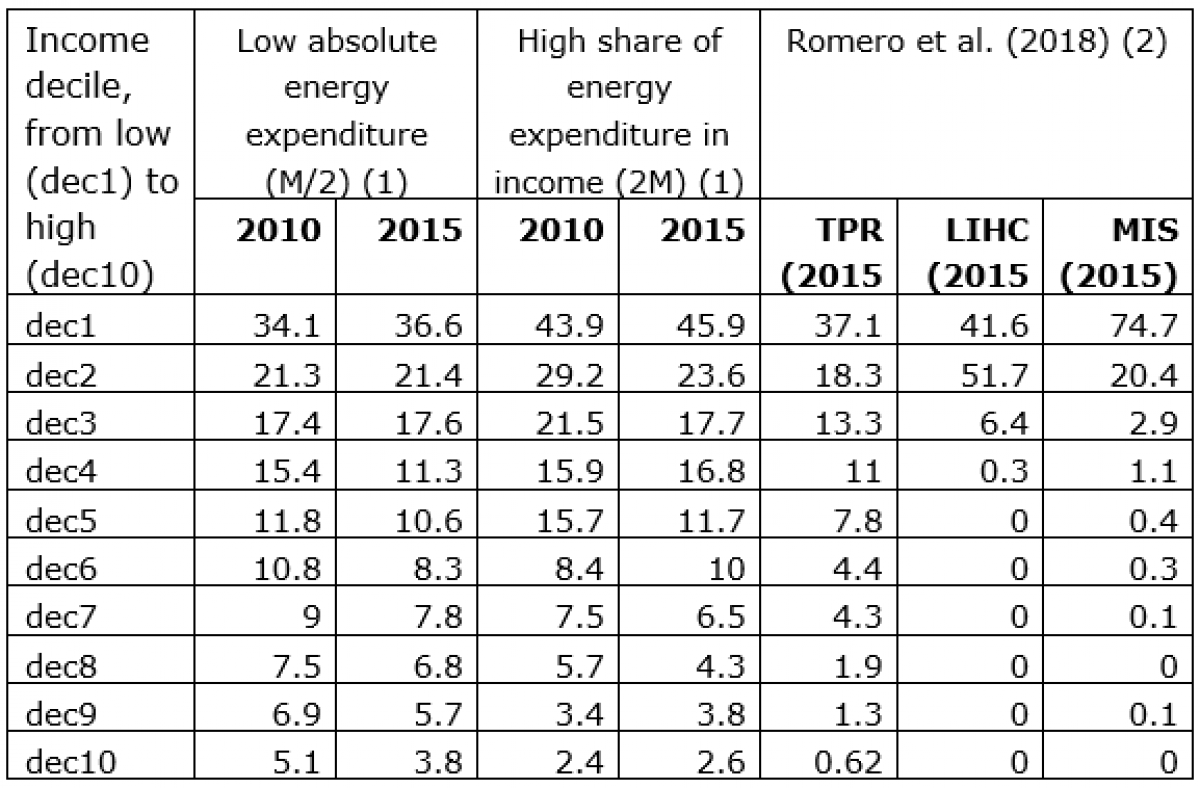
The distribution by income deciles again reveals high energy poverty percentages in the lower income deciles. Tirado and Jiménez Meneses (2016) also analysed energy poverty in Spain after the crisis of 2007-08 and during the austerity period that followed. The “Arrears on utility bills” and “Inability to keep home adequately warm” variables indicate a 50 per cent increase in the rate of households affected between 2006 and 2012.
Calculated values by Romero et al. (2018) for lower incomes show much higher values for the indicator based on Minimum Income Standard (MIS) than for the 10% indicator, and in their opinion, despite the difficulty of calculating the MIS, these high values are more appropriate because they reflect better the effect of low incomes, and not the effect of high energy bills as with TPR. On the socio-economic factors affecting energy poverty, low-income households with children, paying rent, and with an unstable employment situation are clearly those that are the most vulnerable.
Romero et al. (2018) analysed energy poverty through disaggregation by region, since that can also highlight the dependence of the results on climatic or income factors. The ACA report and Tirado and Jiménez Meneses (2016) also performed the same analysis, and both confirm that regions with higher unemployment contain a larger proportion of households with an enforced deficit of domestic energy services as indicated by SILC indicator 'inability to keep the home adequately warm'. Even if milder winters reduce domestic energy needs, it is suspected that homes in Southern Spain and Canary Island are more likely to lack central heating and to be poorly insulated. On the contrary, although the climate conditions are worse than in the South of Spain, Madrid, the Basque region and Navarra are in a better position compared to the other regions in Spain thanks to their higher GDP per capita and regional social benefits.
Moving forward, the Spanish energy policy is part of social policy, typically taking the form of financial assistance but only defined for the case of the electricity market. The social tariff was approved in 2009. The 6th October 2017, the Spanish parliament approved Royal Decree 897/2017, regulating the definition of vulnerable consumers, social tariff and other protective measures for domestic consumers of electrical energy. The “vulnerable consumer” is defined as a consumer of electricity in his/her permanent residence whose individual or household annual income is below 1.5 times the Public Income Indicator of Multiple Effects (Indicador Público de Renta de Efectos Múltiples, IPREM), the indicator of income used by Spanish public administrations to determine access to a series of social protection schemes. This threshold is increased according to household size, if suffering a disability, in case of gender-based violence, or being a victim of terrorism. The rate of the discount, up to a limit on energy consumption, depends on the consumer category.
- 25% of the electricity bill for the “vulnerable consumer”, as previously described;
- 40% discount for the “severely vulnerable” consumer, i.e. any individual or family with an annual income below 50% of the annual IPREM;
- 50% discount for those who receive the assistance from the social services and are considered as “very severely vulnerable consumer”.
As the Spanish electricity market is regulated, and only biggest retailers are designated as reference retailers, the social tariff can be only offered by those reference retailers. More information is available in a 2018 EU brief.
The ACA 2018 report highlighted that less than 50% of households in fuel poverty according to the indicators used by the Spanish Government – mainly income – qualify for this discount rate. For those meeting the requirements for this rate, the assignment of the social tariff is not automatic; rather, households have to apply for it. In the end, this means a large number of potential beneficiaries are not taking the social tariff they qualify for. According to the CNMC, only half of consumers even knew of the existence of the social tariff, and 60% of them were aware of the requirements needed to benefit from it. Apart from lack of information, reasons for not taking up the social tariff include the fear of stigma associated with receiving this benefit.
In October 2018, the new government approved the Energy Transition Law, including more changes in the previous electricity social tariff (although no major changes), and announcing the new “heating social bonus” for the beginning of 2019, which is linked to the electricity social tariff. The National Strategy against Energy Poverty 2019–2024 approved by the Spanish Government in March 2019 seeks to reduce the levels of the current energy poverty indicators – arrears on utility bills, inability to keep home adequately warm, hidden energy poverty (HEP), and high share of energy expenditure in income (2M) – by at least 25% but seeking to reach 50% reduction. The Spanish Government seeks to address a situation that affects between 3.5 and 8.1 million citizens.
Costa-Campi et al. (2020) state that the main determinant of energy poverty is fundamentally linked, directly or indirectly, to household income. They conclude that the impact of the characteristics of Spanish homes and climatic conditions is minor, disregarding the fact that energy costs result from a combination of energy performance of the building, energy prices and energy needs due to the climate. As mentioned above, the mild weather conditions in some Spanish regions cannot counteract the low energy efficiency of the building stock and high energy prices. It was also analysed how the energy expenses increase as a share of income from 2005 to 2015, and the increase is proportionally higher for the lower quintiles. To conclude, although household income is key for determining energy poverty levels, more information is captured if ratio between income and energy costs is used.
As a result, Costa-Campi et al. (2020) propose that vulnerable (energy) consumers should be preferably protected through mechanisms developed within the framework of the general welfare (social protection) system. This strategy is not without its drawbacks; if the solution to energy poverty is left to current regulation, the high prevalence of non-uptake of the social tariff among qualified customers has already been observed. Different opinions can be found in Spain, e.g. the Alliance Against Energy Poverty (APE) advocates that utilities should pay these benefits, which (in the author's opinion) seems unlikely to happen; most likely, the energy companies will include the amount to pay in the tariff, so that in the end these benefits will be paid by all consumers. Other measures might be more successful, such as the energy efficiency obligation scheme included in the Energy Efficiency Directive (2012/27/EU).
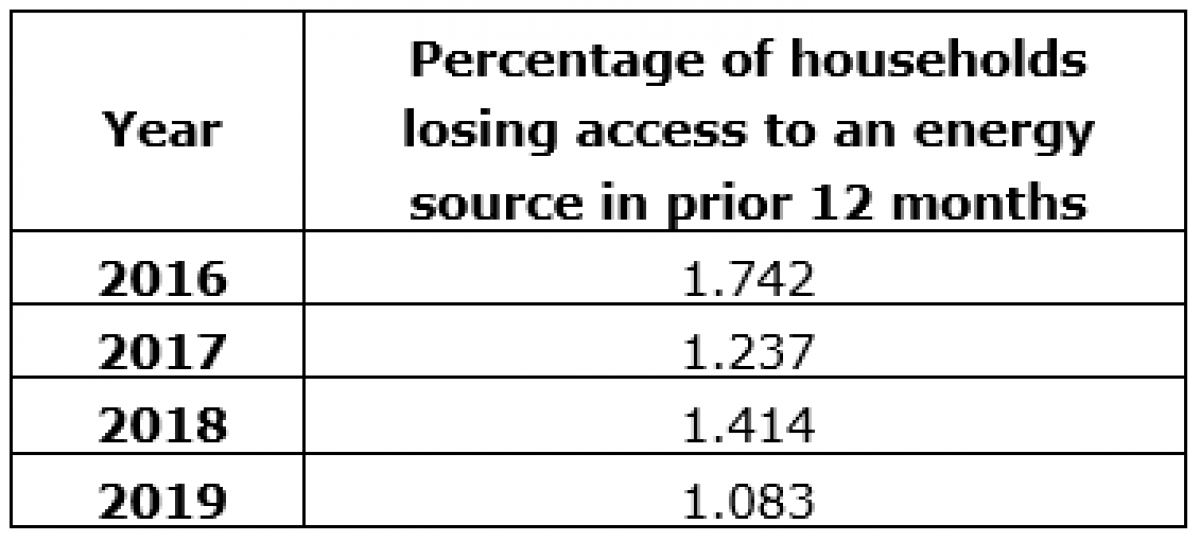
APE's advocacy for an end to supply disconnections for vulnerable consumers speaks to an important protection for the energy poor. According to the new law, electricity cuts are only allowed after a waiting period of four months after invoice issue for vulnerable customers, but are in no way allowed for vulnerable customers who are at risk of social exclusion. In all cases, social services have to be given advance notice of pending disconnections. In this way, the regulatory protection against power cuts places all responsibility in the hands of local administrations, and it will not be possible to protect the most vulnerable families from cuts if the local administration fails to cover its share of the social tariff. Unfortunately, there are no official statistics to know the magnitude of the problem; the most relevant data available are only recorded since 2016 and are collected in Table 5. This data shows that each year, somewhere between 1% and 2% of households who were unable to keep their homes adequately warm had lost access to a usual source of energy over the prior 12 months.
Not surprisingly, according to the report from ACA in 2018, the income deciles most affected by the lack of energy supply are the lowest ones.
Low incomes and energy poverty in the policy debate in Spain
While acknowledging its negative effects, the crisis of COVID-19 is an unprecedented opportunity for field studies on different aspects. In 2020, as an aid package against the effects of the COVID-19 pandemic, a Royal Decree-Law included a prohibition on interrupting the supply of electrical energy in any home considered to be a first home, through the end of May 2021. Studying the number of power disconnections in 2020-2021 month by month will likely reveal whether the number of power cuts has only been delayed and finally concentrated in the end of this period.
Another unusual measure that could have a significant impact on energy poverty levels, also recently approved by the Spanish Parliament, is the Minimum Vital Income (Ingreso Mínimo Vital, IMV), a guaranteed minimum income scheme. Before COVID-19, only two regions in Spain had something similar with a generalized implementation, the Basque Country and Navarra. As explained above, energy poverty indicators report significantly lower levels in these two regions, despite their colder climate. After the IMV has been fully developed, this measure is likely to decrease energy poverty rates, in parallel to the relatively low poverty rates in the regions where a similar measure had already been implemented.
This exceptional occasion will serve to test the effectiveness of social protection through income increases. But it will not help understand the effect of preventive measures for energy poverty, which in Spain are very scarce, especially for low-income households. However, by looking at the data for households living in well-insulated housing, such as social housing, it would be possible to analyse data by income distribution to see if lower-income households successfully move out of energy poverty.
There are other situations where vulnerable households have low energy consumption, but not because they live in well-insulated dwellings: when they restrict their energy consumption due to economic difficulties, a so-called "underconsumption" of energy. The issue was first studied in the Basque rental social housing by Antepara et al. (2020a). It will also be a subject of study for the Union Urban Innovative Action EPIU, carried out in Getafe (Madrid, Spain). Supported by the European Commission, the main challenge of the project will be to identify and fight hidden energy poverty (HEP).
ACER (2016) ACER Market Monitoring Report 2015 - ELECTRICITY AND GAS RETAIL MARKETS. November. Agency for the Cooperation of Energy Regulators and the Council of European Energy Regulators. Available at: https://www.acer.europa.eu/Official_documents/Acts_of_the_Agency/Publication/ACER%20Market%20Monitoring%20Report%202015%20-%20ELECTRICITY%20AND%20GAS%20RETAIL%20MARKETS.pdf.
Antepara, I., Papada, L., Gouveia, J. P., Katsoulakos, N., & Kaliampakos, D. (2020a). Improving Energy Poverty Measurement in Southern European Regions through Equivalization of Modeled Energy Costs. Sustainability, 12(14), 5721. Available at: https://www.mdpi.com/2071-1050/12/14/5721
Antepara, I., Claeyé, F., Lopez, A., Robyns, B., (2020b) Collaborating with social services through energy advice: innovative case from Spain. Ways of improving through smart meters. Revista Vasca de la Economía Social (accepted article)
ASOCIACIÓN, D. C. A. (2016). Pobreza energética en España. Nuevos enfoques de análisis. Available at: https://niunhogarsinenergia.org/panel/uploads/documentos/estudio%20pobreza%20energetica_aca_2016.pdf
ASOCIACIÓN, D. C. A. (2018). Pobreza energética en España. Hacia un sistema de indicadores y una estrategia de actuación estatales. Available at: https://niunhogarsinenergia.org/panel/uploads/documentos/informe%20pobreza%20energ%C3%A9tica%202018.pdf
CNMC, Panel de Hogares de la Comisión Nacional de los Mercados y la Competencia (CNMC), Available online: http://data.cnmc.es/datagraph/ (accessed on 25 July 2020)
Costa-Campi, M. T., Jové-Llopis, E., & Trujillo-Baute, E. (2019). Energy poverty in Spain: an income approach analysis. Energy Sources, Part B: Economics, Planning, and Policy, 14(7-9), 327-340. DOI: 10.1080/15567249.2019.1710624
Davies, S., Finney, A., & Hartfree, Y. (2016). Paying to be poor: Uncovering the scale and nature of the poverty premium. University of Bristol, Personal Finance Research Centre: Bristol, UK. Available at: https://www.bristol.ac.uk/media-library/sites/geography/pfrc/pfrc1615-poverty-premium-report.pdf
Dubois, U., & Meier, H. (2016). Energy affordability and energy inequality in Europe: Implications for policymaking. Energy Research & Social Science, 18, 21-35. DOI: 10.1016/j.erss.2016.04.015
European Commission EU Energy Poverty Observatory 2018. Available online: https://www.energypoverty.eu/ (accessed on 25 July 2020)
Romero, J. C., Linares, P., & López, X. (2018). The policy implications of energy poverty indicators. Energy policy, 115, 98-108. DOI: 10.1016/j.enpol.2017.12.054
Tirado, S., & Jiménez Meneses, L. (2016). Energy poverty, crisis and austerity in Spain. People, Place and Policy, 10(1), 42-56. Available at: https://extra.shu.ac.uk/ppp-online/wp-content/uploads/2016/04/energy-poverty-crisis-austerity-spain.pdf
Vondung, F., & Thema, J. (2019). Energy poverty in the EU: indicators as a base for policy action. Available at https://epub.wupperinst.org/files/7345/7345_Vondung.pdf